
Machine data in spatial context
Inspect live readings and historical trends beside the equipment they describe. Spatial data views can help people relate measurements to a component, process vessel or location rather than working from a separate dashboard alone.
Potential benefits
- Make readings easier to relate to the correct component or location.
- Reduce the effort of switching mentally between charts and equipment.
- Support a shared understanding of current conditions and historical changes.
Relevant challenges
Operations
- Important information is available, but not where and when it is needed
- Alerts indicate that something is wrong without clearly showing where or why
Process Improvement and Decision Support
- Process data is separated from the physical context in which it was generated
How the approach works
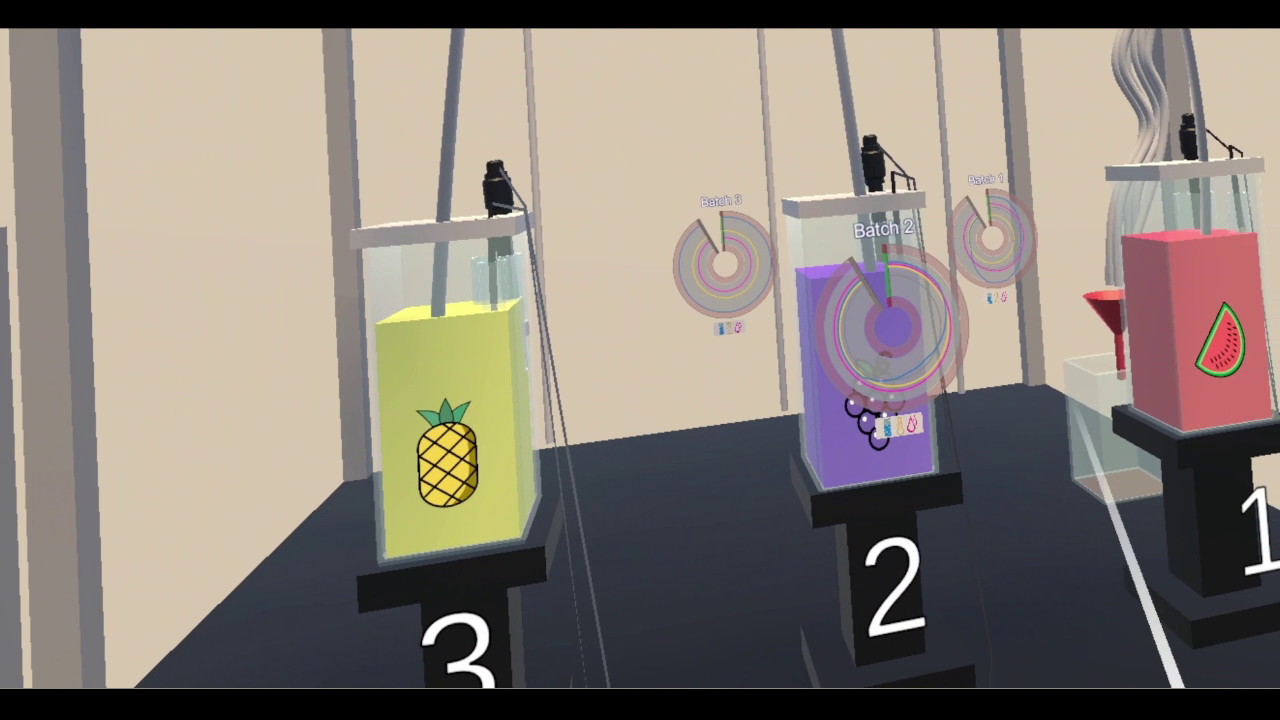
Measurements are associated with components in a physical or virtual equipment model. Selected values and trends appear near those components, with views designed around the information needed for inspection or analysis.
Research and demonstrations
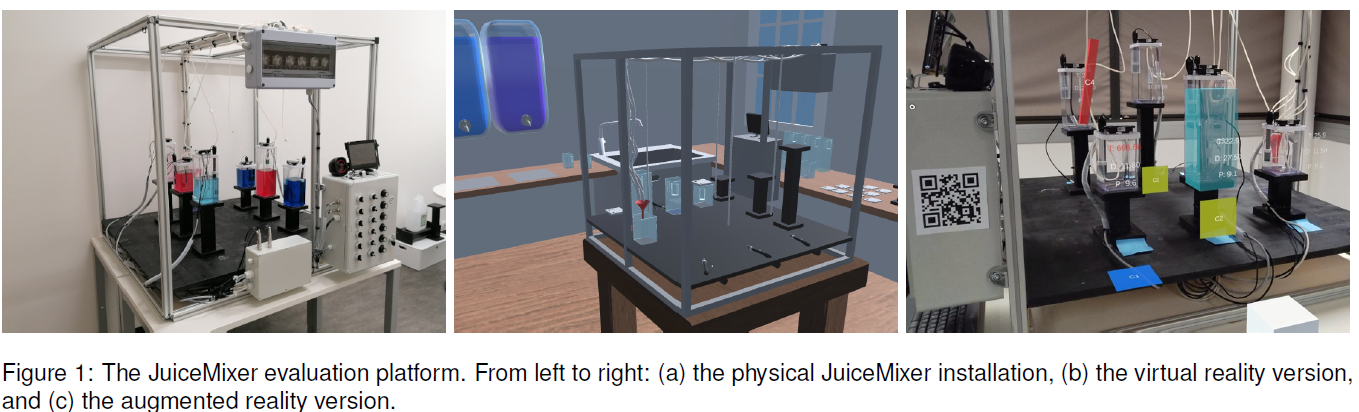
The situated-analytics and spatial-exploration examples show component-linked values, historical trends and sensor information on equipment models. They illustrate the same principle across process equipment and an industrial machine example.
Adapting it to your workflow
A project would connect the available data sources, agree the meaning and units of each measurement and map readings to equipment locations. Display content and update requirements would be defined around the intended workflow.
What a project could evaluate
A project could assess whether users locate relevant information, identify the associated component and interpret current conditions or historical changes correctly. Task time and reported mental effort could be compared with the team’s current information views.