Machine data in spatial context
Position measurements around the equipment or locations they describe. Analysts can inspect selected values while retaining an overview of their physical relationships.
 EIRS
All demos · Industrial challenges
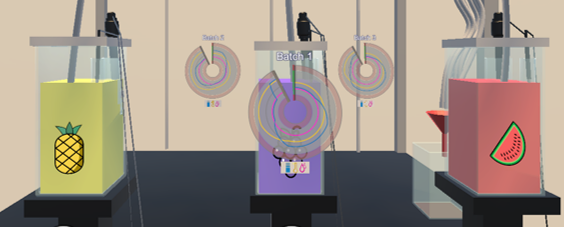
Explore measurements alongside the equipment or locations they describe in virtual reality (VR). The platform brings together three examples for expert analysis: a virtual JuiceMixer process rig, racing telemetry and sensor data on an industrial machine model.
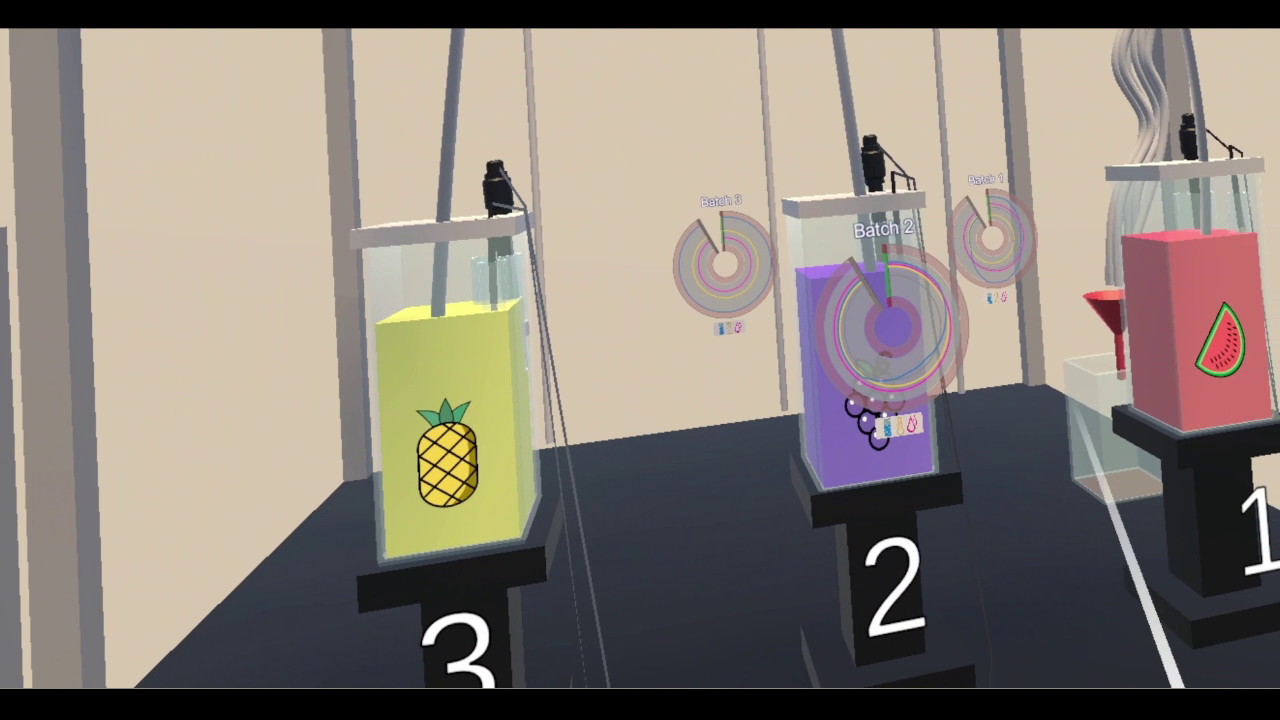
Compare measurements while keeping their physical relationships visible. Experts can use familiar charts for detailed comparison and spatial views to understand where a value or event belongs.
A Unity VR analysis platform presents equipment models, route geometry and their associated data. The process example uses a virtual model of the JuiceMixer liquid-process testbed. The racing example uses simulator telemetry, while the industry-machine example positions sensor information on a machine model.
Experts can compare overall trends, locate differences in space and inspect selected details without losing the connection between the measurements and their source.
A chart can reveal a change without making its location immediately obvious. Experts then need to connect that change to a process vessel, machine component or point on a route. Comparing several measurements adds further demands on this mental mapping.
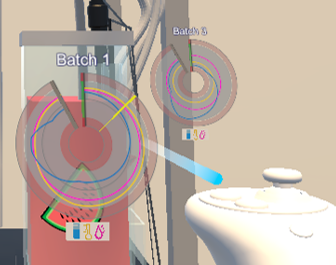
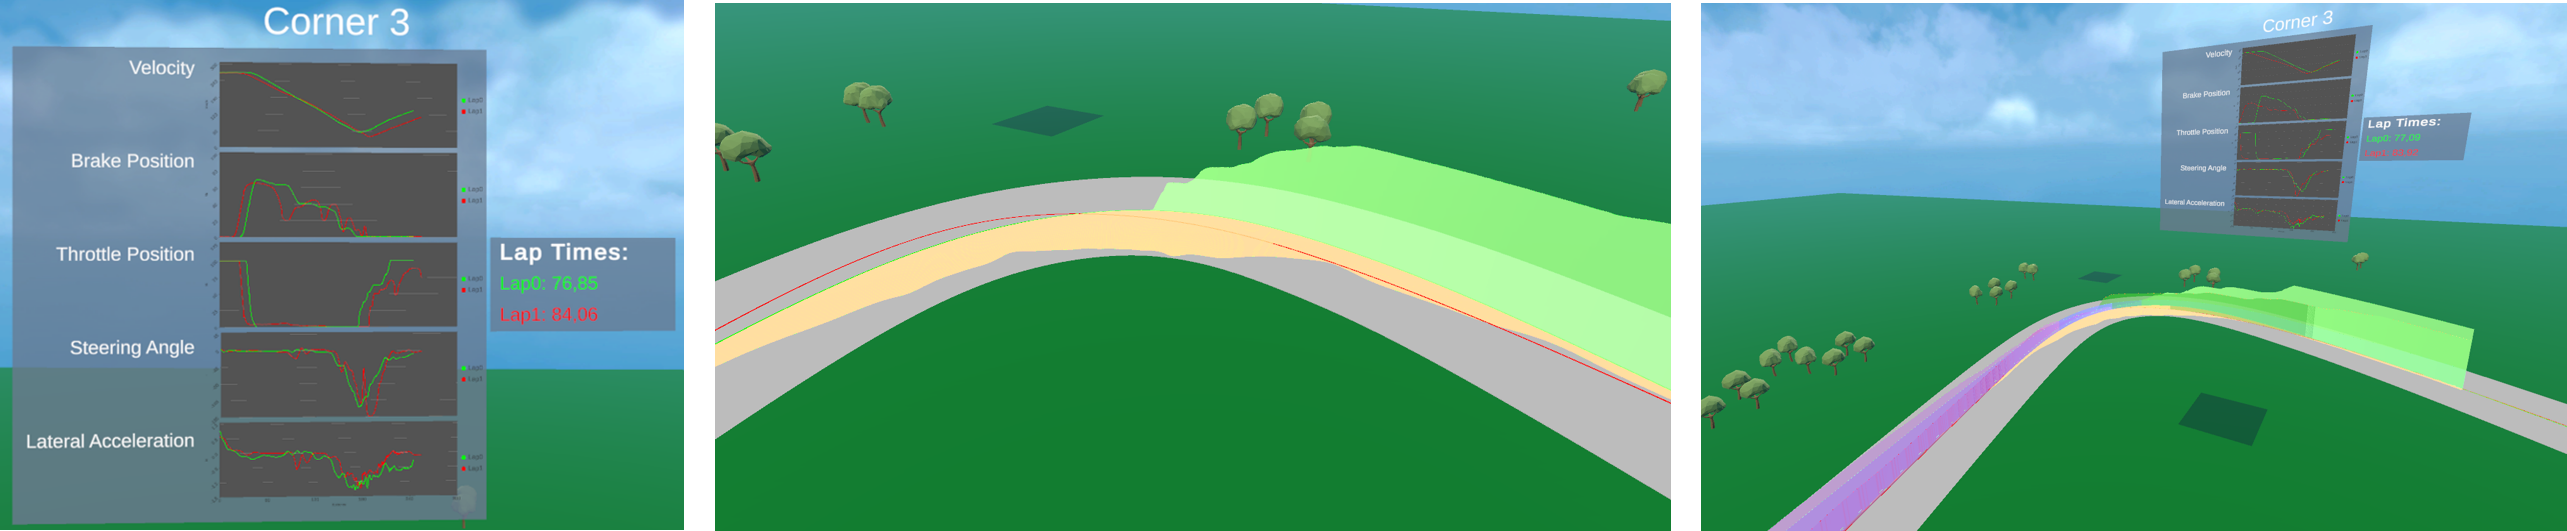
The platform provides chart views, situated views and combined views. Chart views support comparisons across values and time. Situated views place data beside its corresponding equipment or track location. A combined, or hybrid, view brings both forms together.
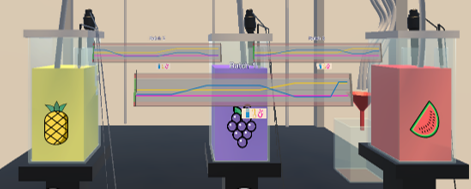
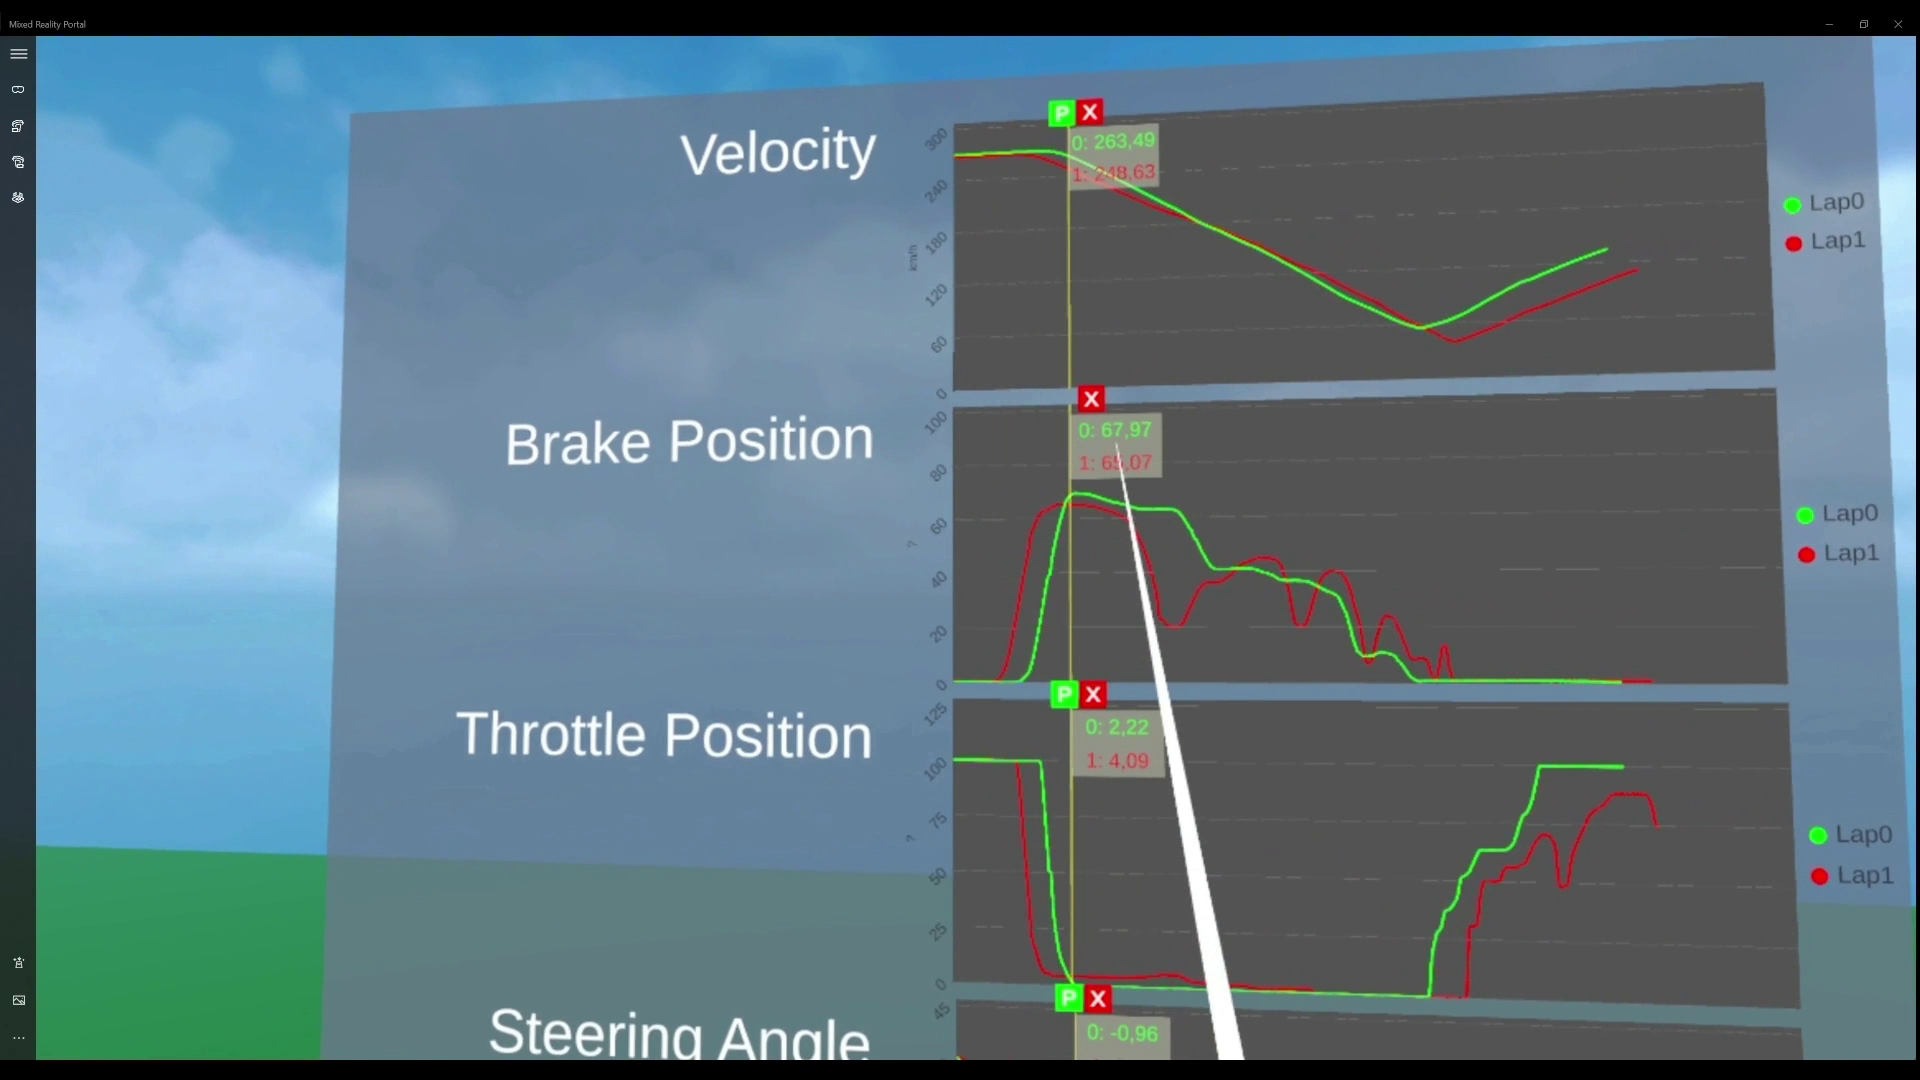
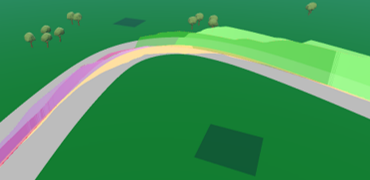
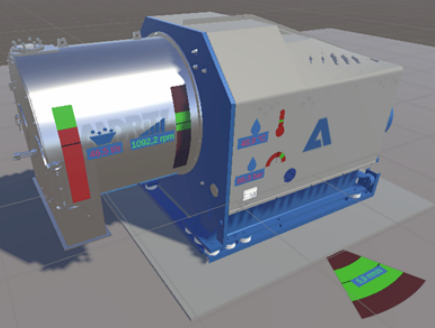
Process readings appear in linear or radial layouts near the relevant virtual vessels. Racing data can appear as conventional line charts, spatial graphs along the track or a linked combination of both. On the industrial machine model, labels and colour-coded indicators identify component measurements.
An expert chooses the view suited to the question, compares values or lap traces, then opens details for a selected vessel or track location. Linked chart and spatial views support moving between a numerical difference and the location where it occurs.
The immersive analysis application is built in Unity 3D. The racing example uses simulator telemetry with up to 800 channels sampled at 100 Hz and was evaluated on an HP Reverb G2 Omnicept headset with an NVIDIA RTX 3080 desktop PC. The JuiceMixer data platform uses a Raspberry Pi for sensing and actuation, Python and Flask for interface services, MQTT messaging and InfluxDB 2.0 for time-series storage.
In an exploratory study with racing engineers, participants preferred the hybrid view that combined line charts with the 3D track. The design insight is to retain familiar comparisons while making spatial relationships available alongside them. This preference comes from the racing-analysis study and does not establish an advantage for every analysis task.
Further development could extend the connected VR platform with additional machine models and confirmed sensor feeds, tailor views to expert workflows such as condition monitoring and troubleshooting, and evaluate how the views support interpretation and decision-making with industrial users.
A chart can reveal a change without showing where it happened. Connecting measurements with equipment or a spatial environment gives analysts another way to investigate relationships, compare events and understand the conditions behind the data.
Position measurements around the equipment or locations they describe. Analysts can inspect selected values while retaining an overview of their physical relationships.
Link detailed charts with spatial views to compare operating periods, events or recorded runs. A project could adapt the interactions to the comparisons that matter to the intended analysts.
Explore unusual measurements alongside related components and historical information. The views could support investigation and comparison, with any automatic detection developed separately for the application.
A collaboration could connect a representative dataset with an equipment model or spatial environment and evaluate how well the views support expert analysis.
Explore research and collaboration →Explore JuiceMixer process data through linear and radial VR views.
Compare racing telemetry in chart-based and track-based VR views.
This work is part of DDIA, Data Driven Immersive Analytics in Digital Industries.
DDIA is an FFG COMET Module (2022 - 2026) at Know Center Research GmbH.