Understand abnormal machine conditions
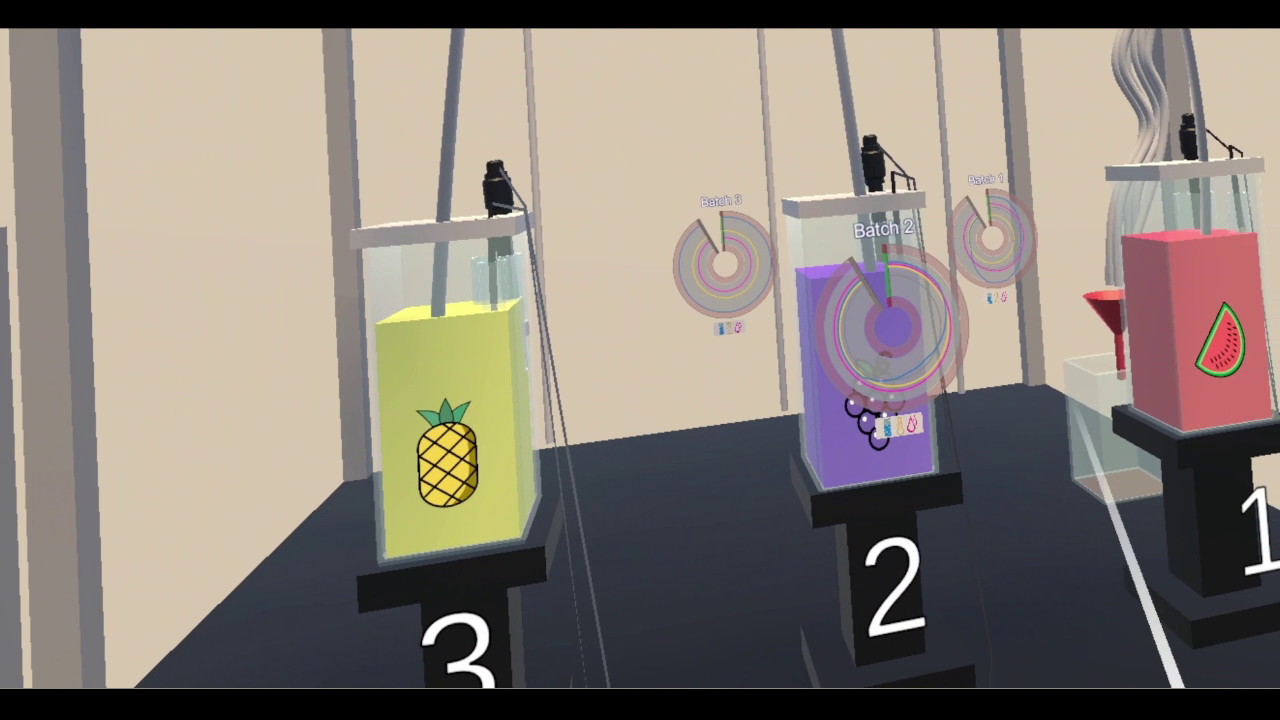
Relate unusual readings or observations to the equipment and process they concern. Visualisation and reporting tools can support investigation by making relevant values, locations and historical context easier to inspect.
Potential benefits
- Make unusual conditions easier to locate and investigate.
- Help teams interpret readings with relevant historical and equipment context.
- Support clearer handover of observations for follow-up.
Relevant challenges
Operations
- Alerts indicate that something is wrong without clearly showing where or why
Process Improvement and Decision Support
- Having more data does not always make the current situation easier to understand.
How the approach works
The application presents selected indicators and trends alongside the associated equipment. Operators can inspect changes, compare context and report observations that need attention. Detection rules or thresholds would be defined for the intended application.
Research and demonstrations
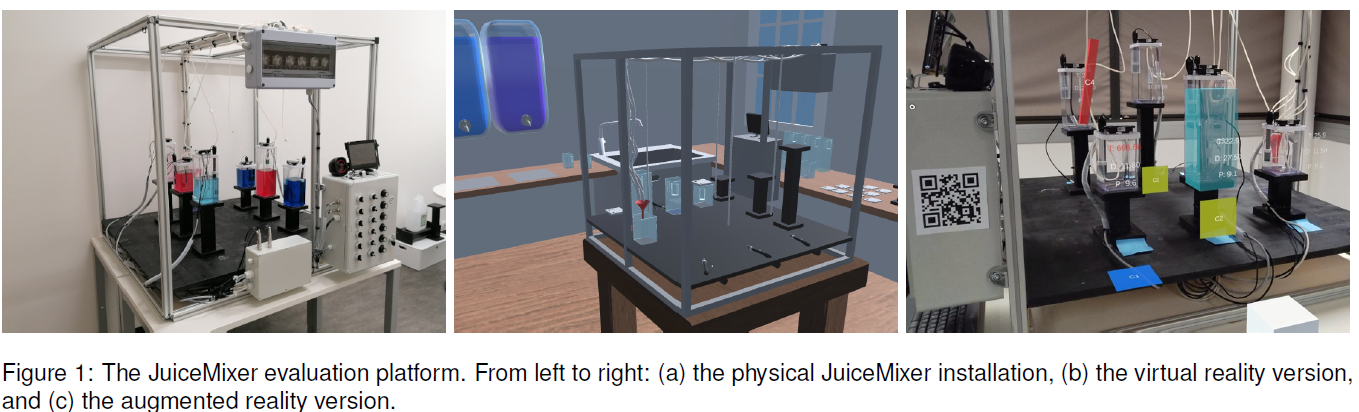
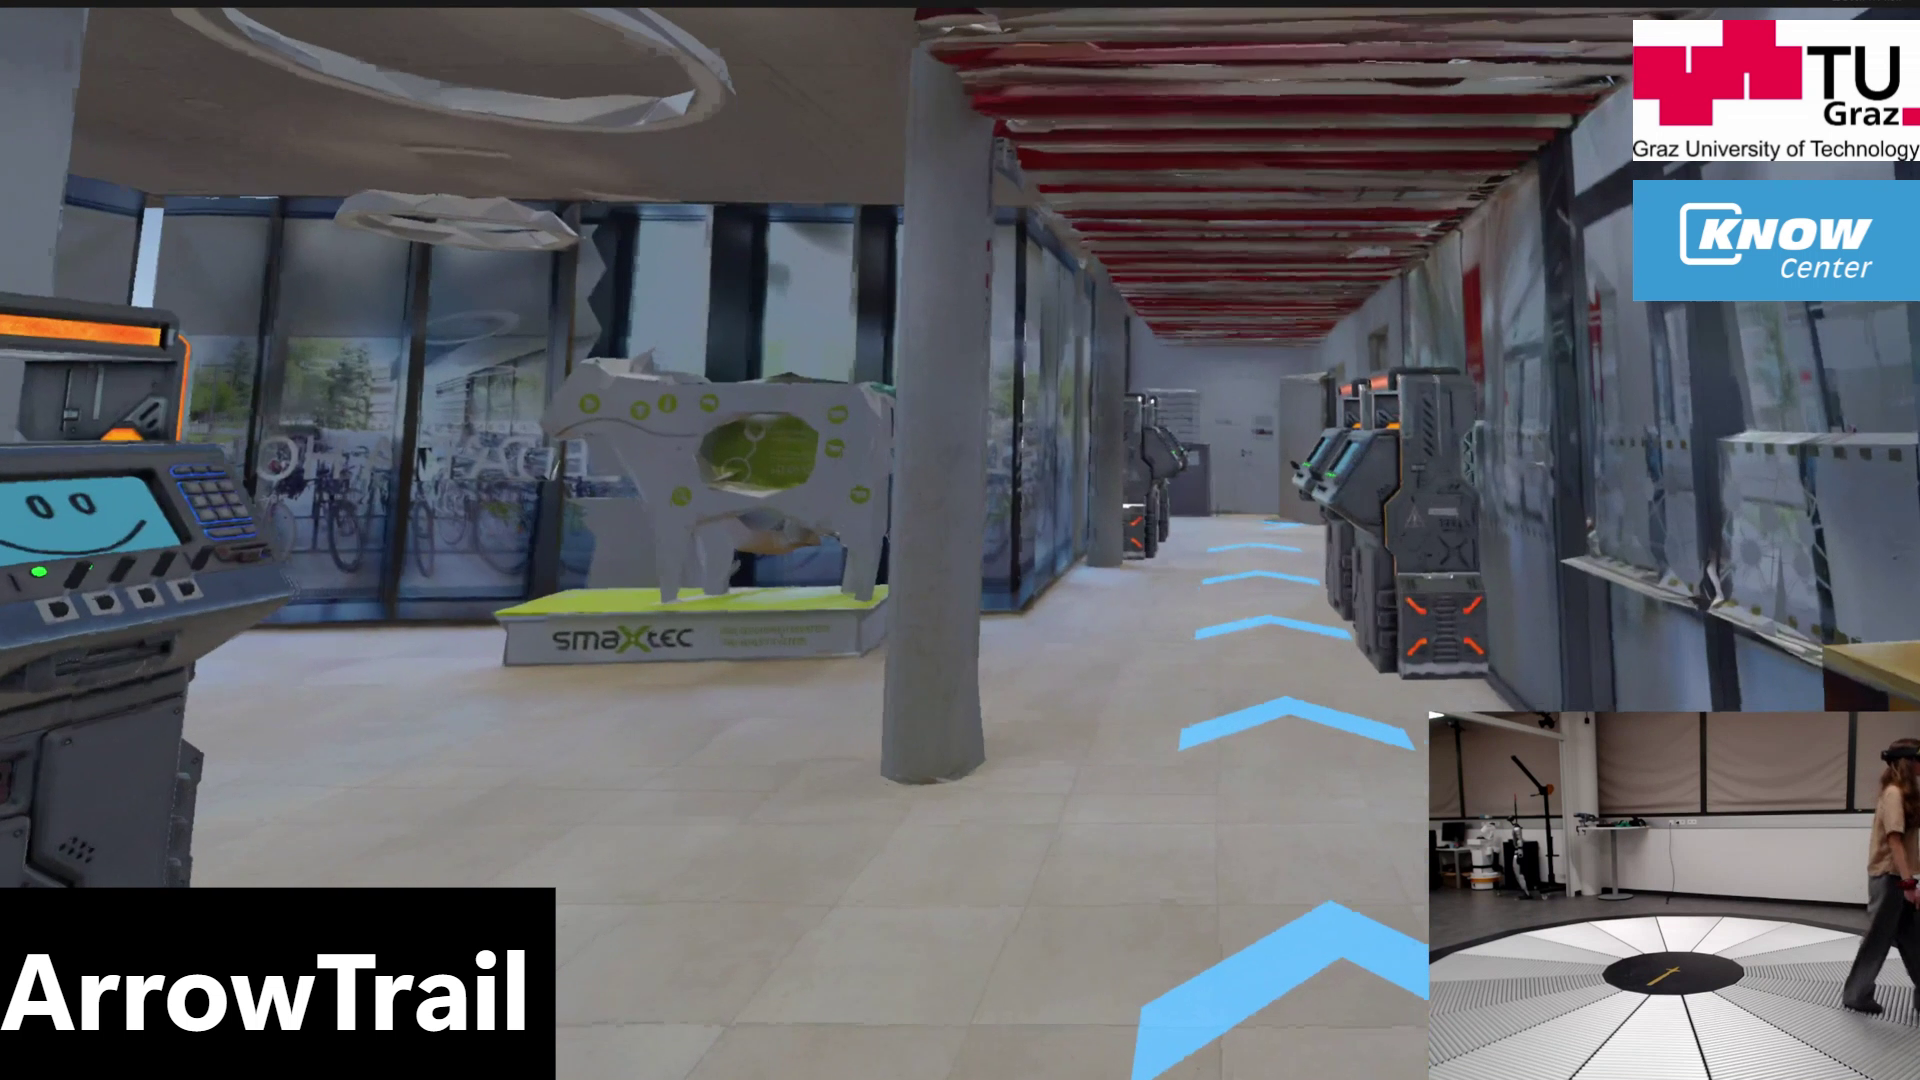
The data-visualisation examples show live readings and contextual analysis, while the navigation study includes reporting of observed hazards and machine anomalies. These support human inspection and interpretation. An automatic detection system would require additional development and evaluation.
Adapting it to your workflow
A project would define the abnormal conditions of interest, select suitable measurements and agree how observations or thresholds should be presented. Any automatic detection method would need its own evidence and validation.
What a project could evaluate
A project could assess whether users recognise and locate relevant conditions, interpret the information correctly and communicate useful observations for follow-up.