Machine data in spatial context
Connect readings and historical trends to the vessels, components or locations they describe. Teams can inspect measurements while keeping their relationship to the process visible.
 EIRS
All demos · Industrial challenges
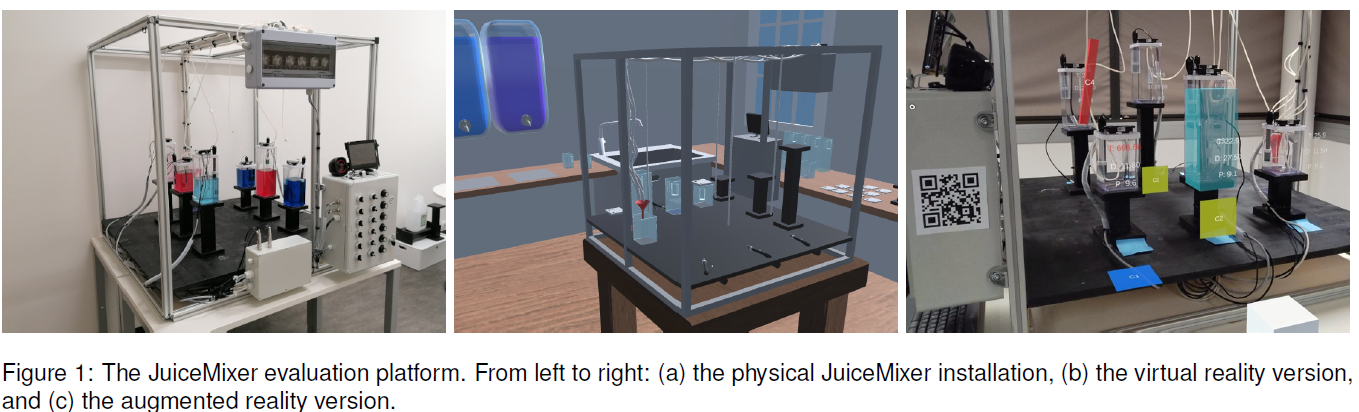
A digital twin links a digital representation of equipment with data from the real system. Explore this connection through a physical process testbed, a virtual reality (VR) model and an augmented reality (AR) view that places live measurements and historical trends beside the equipment.
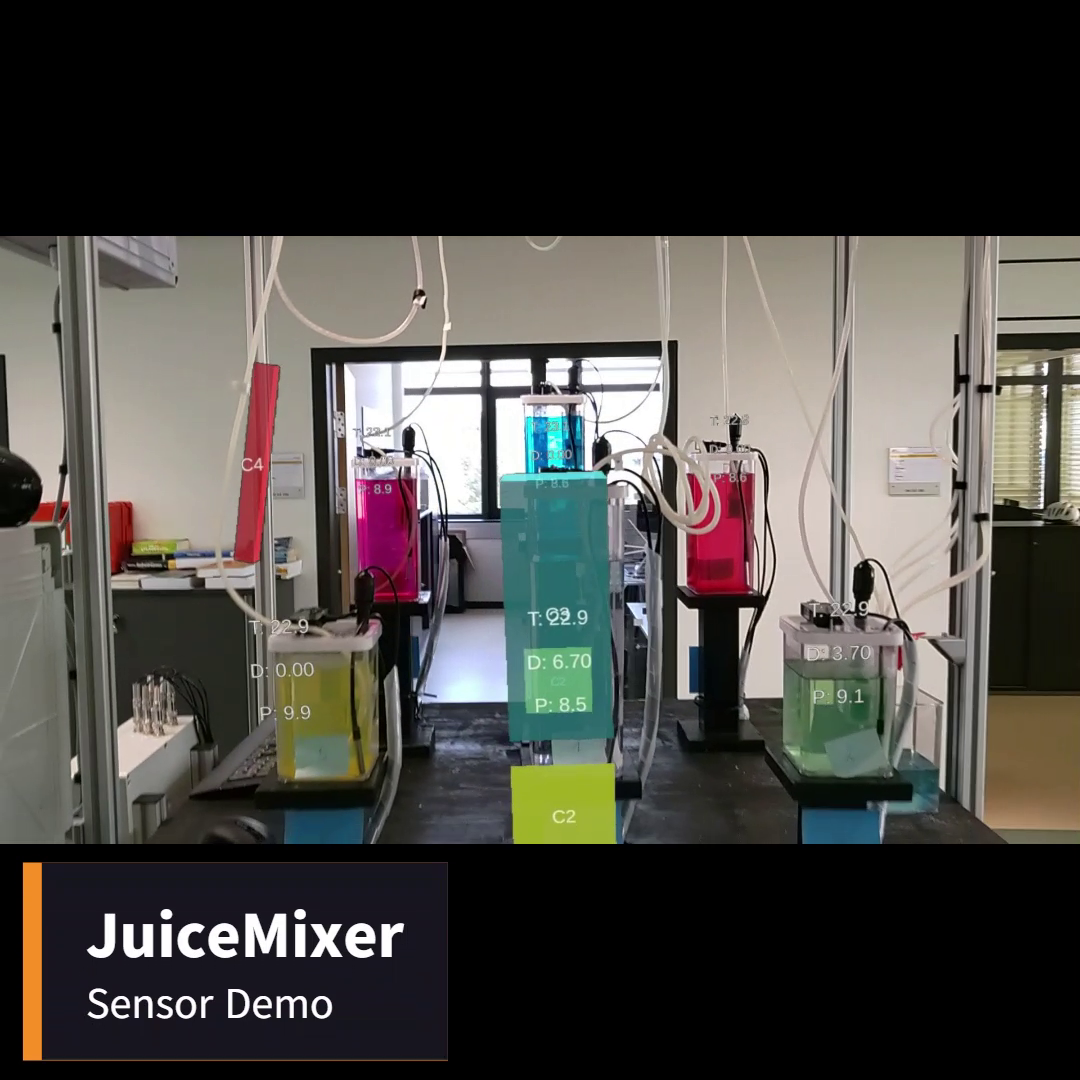
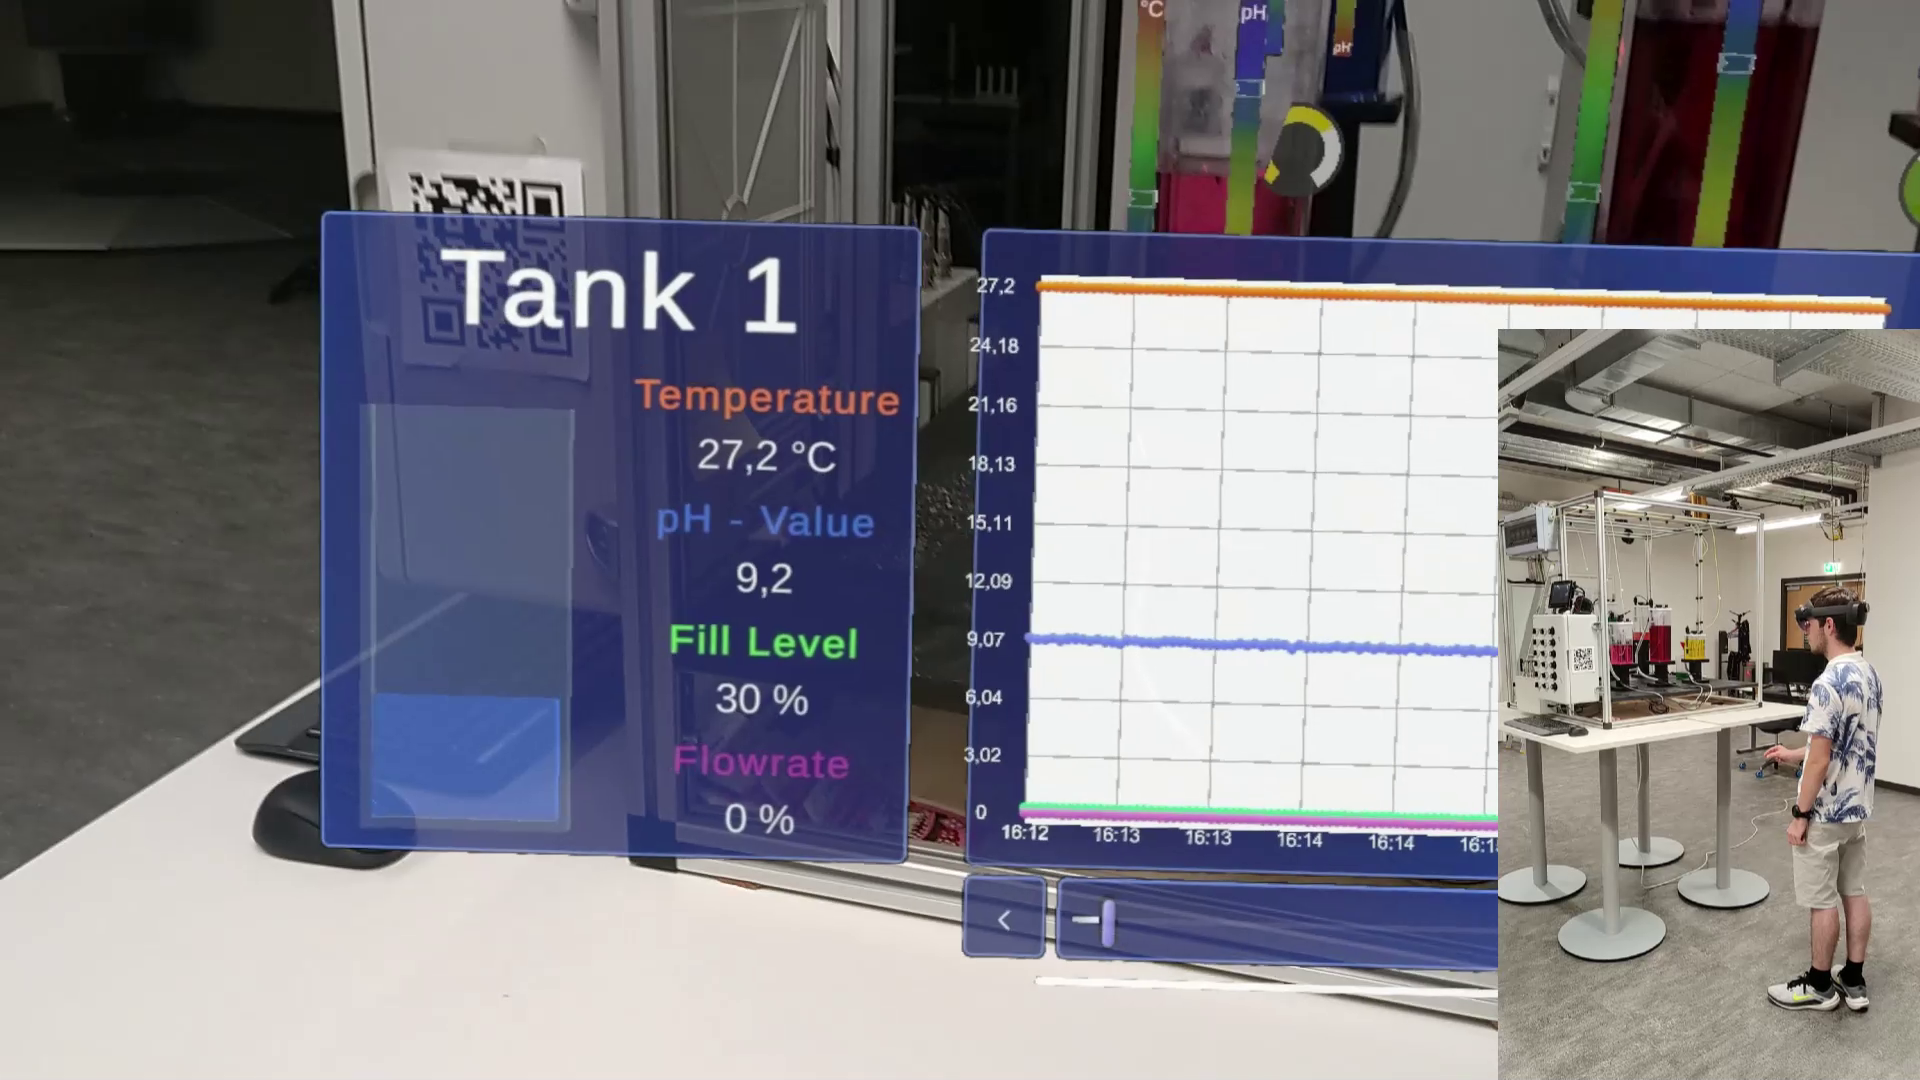
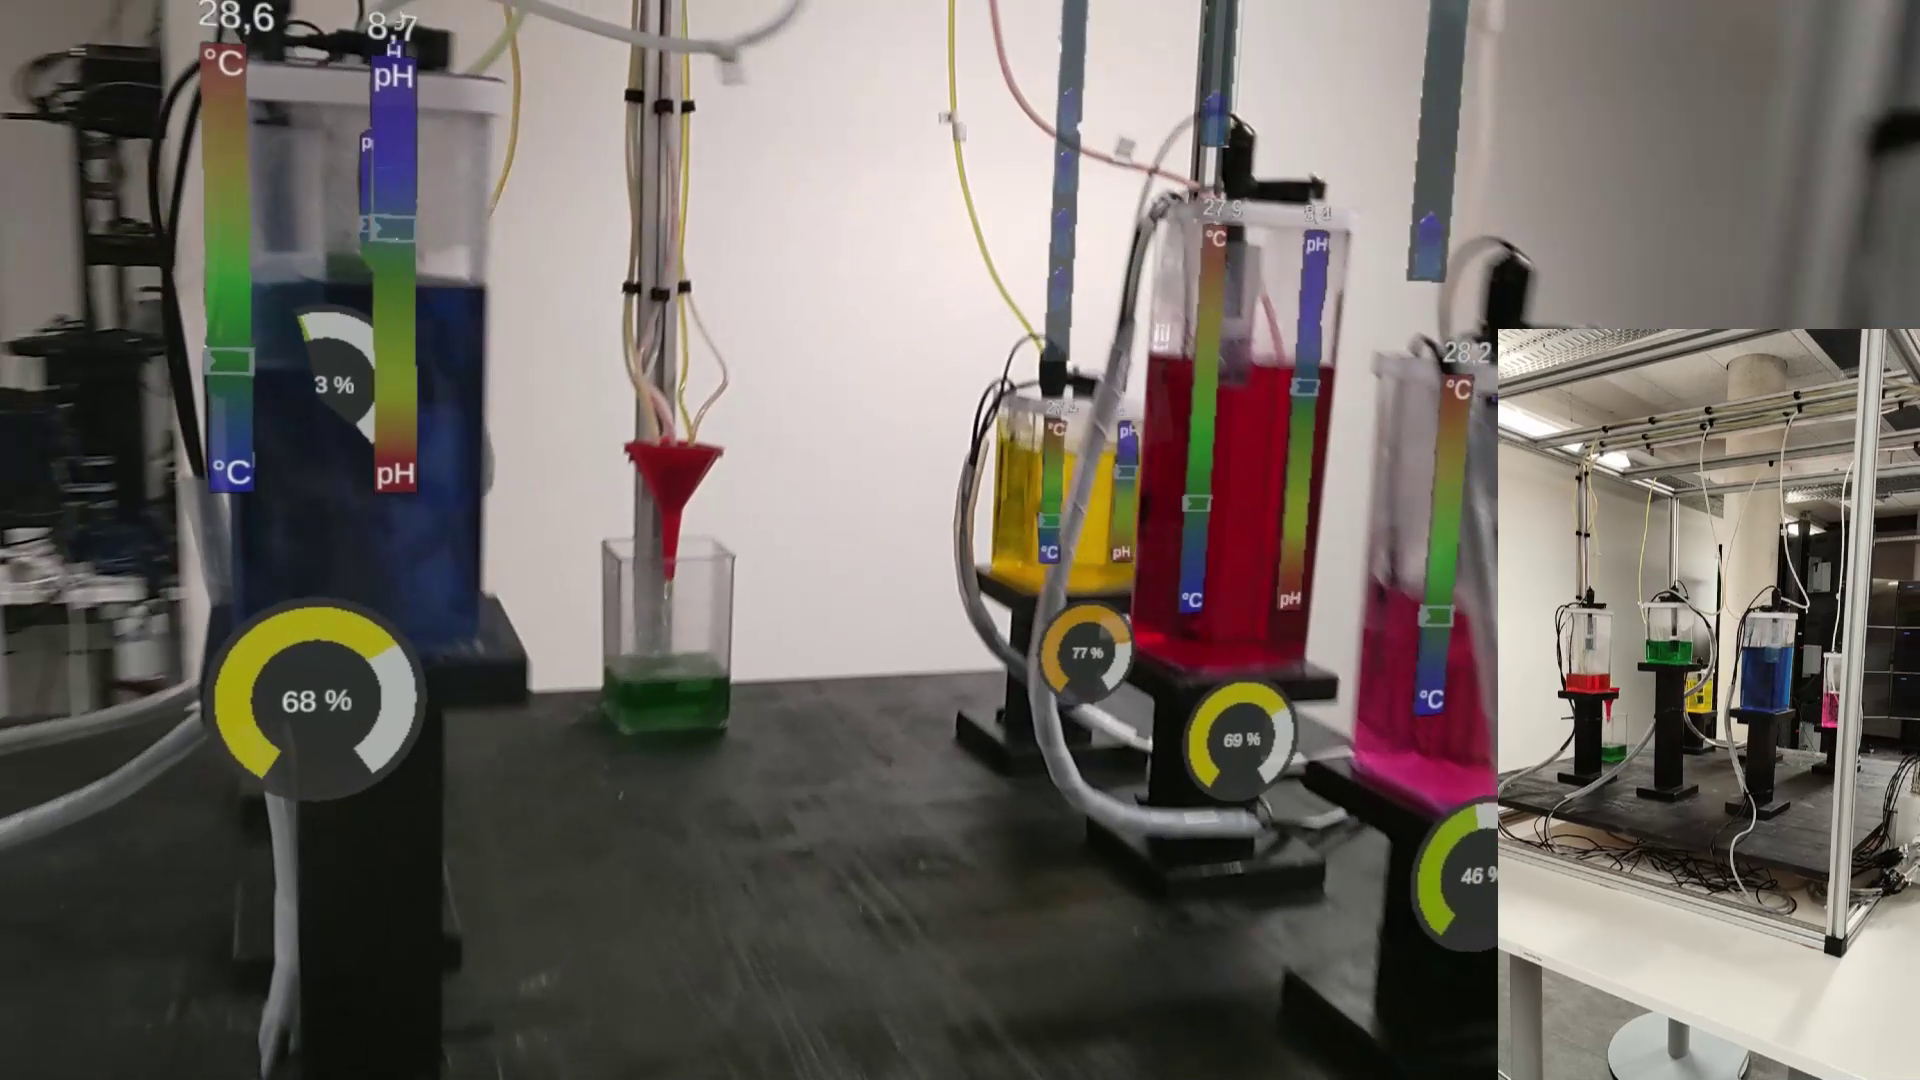
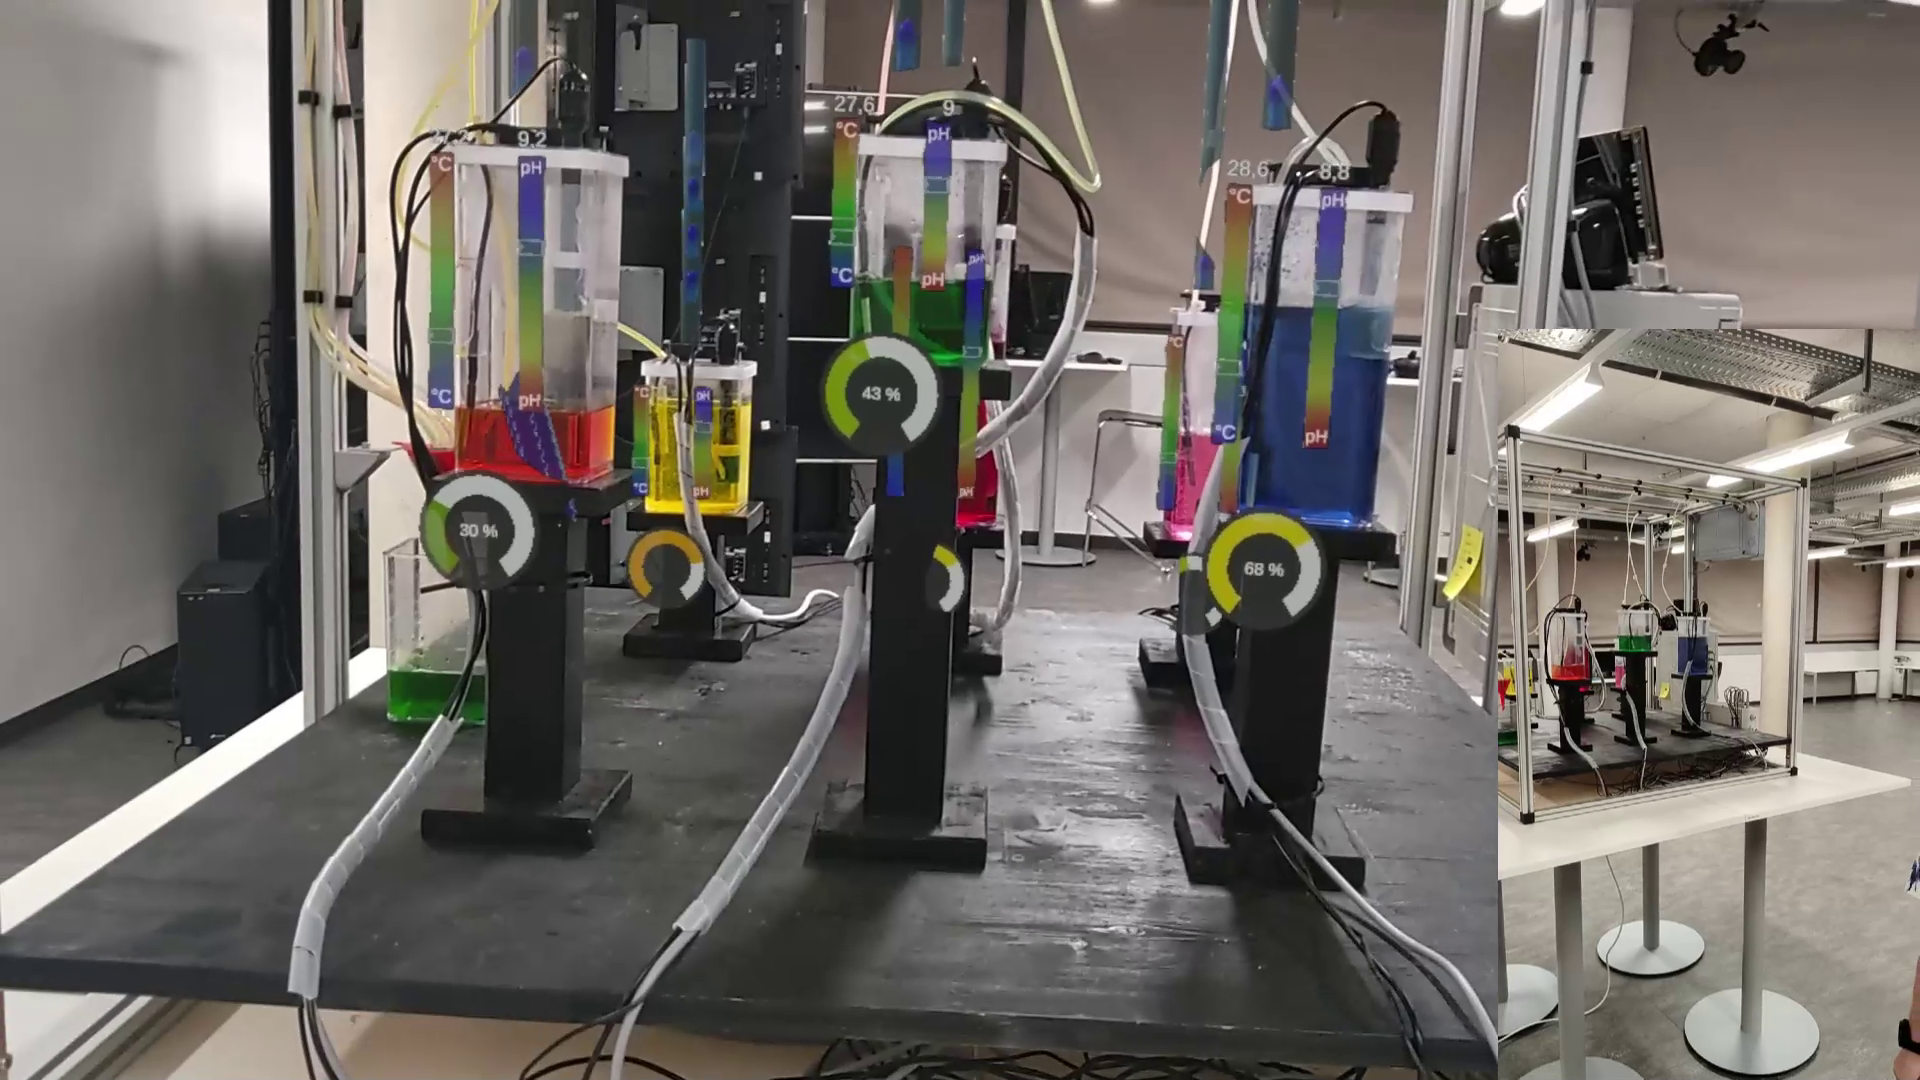
Bring process information into the operator’s view of the equipment. Measurements appear beside the components they describe, supporting inspection of the machine and its data together.
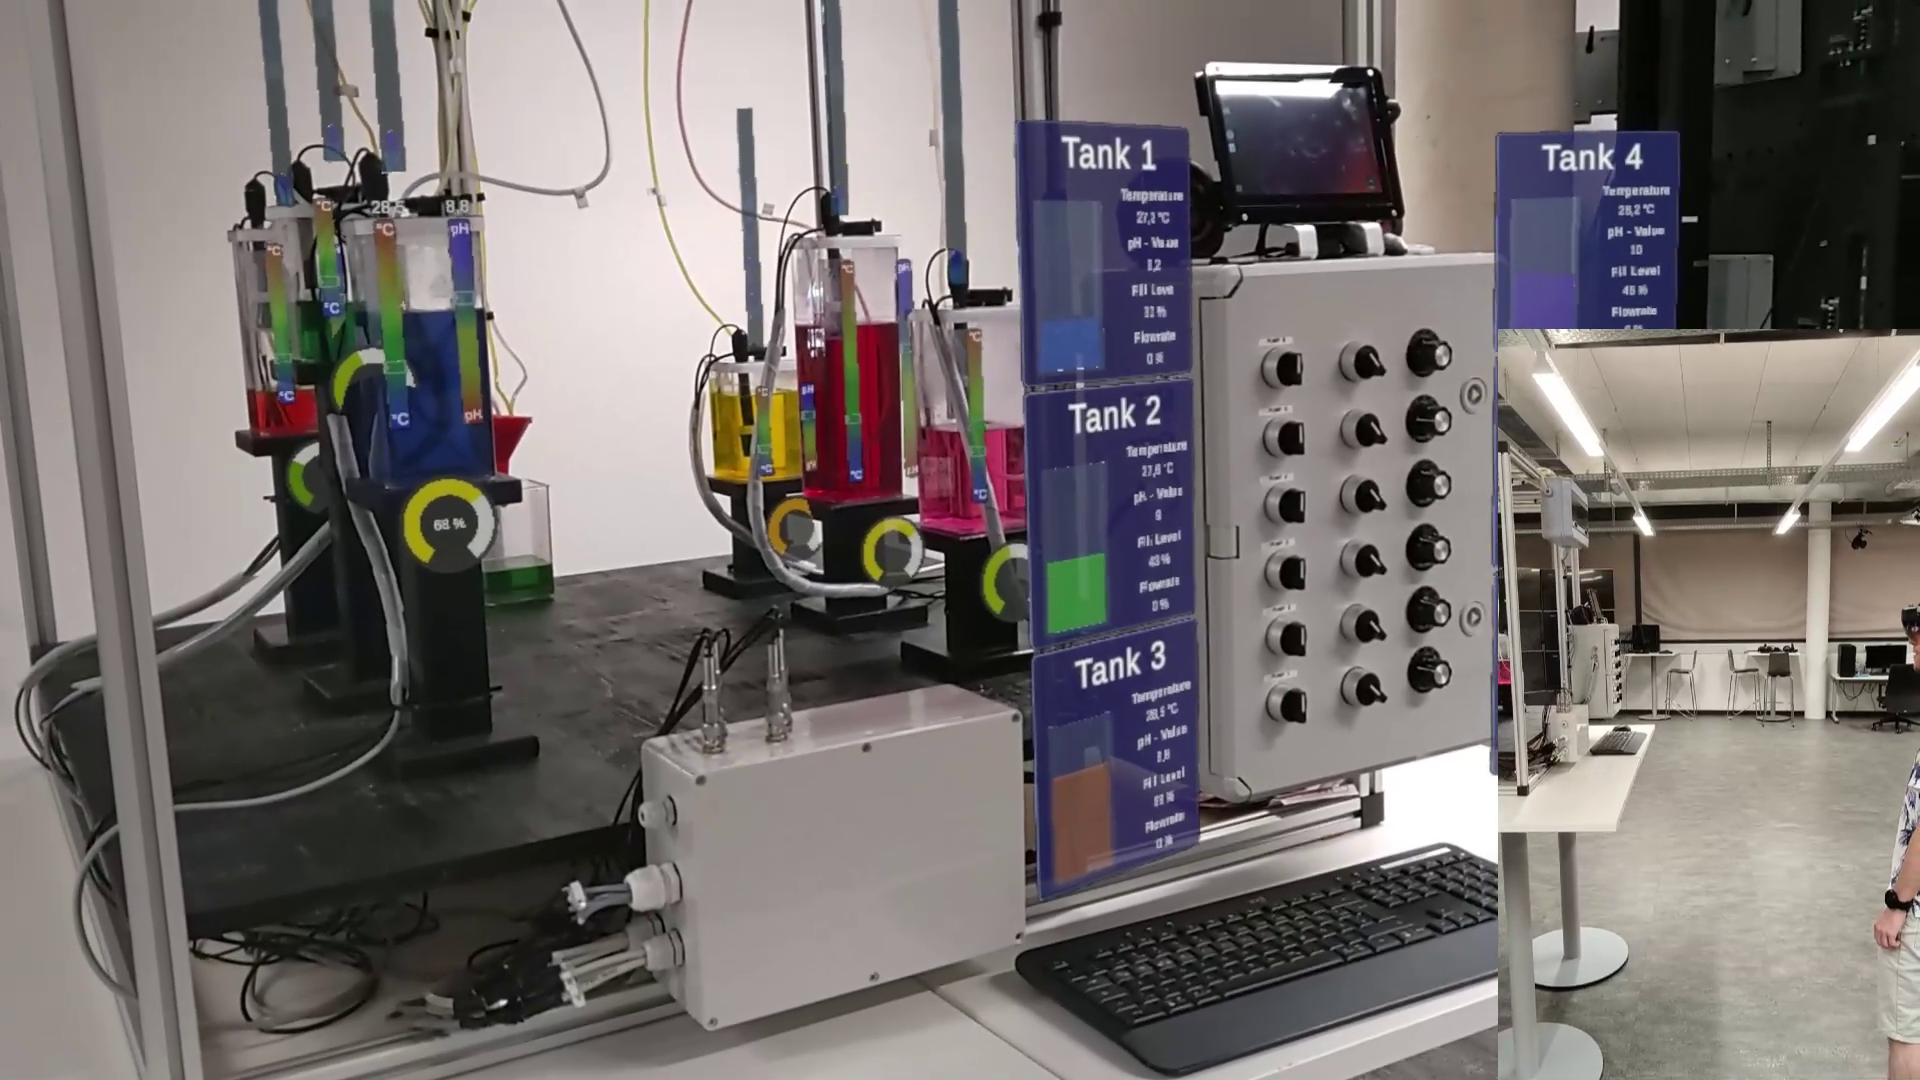
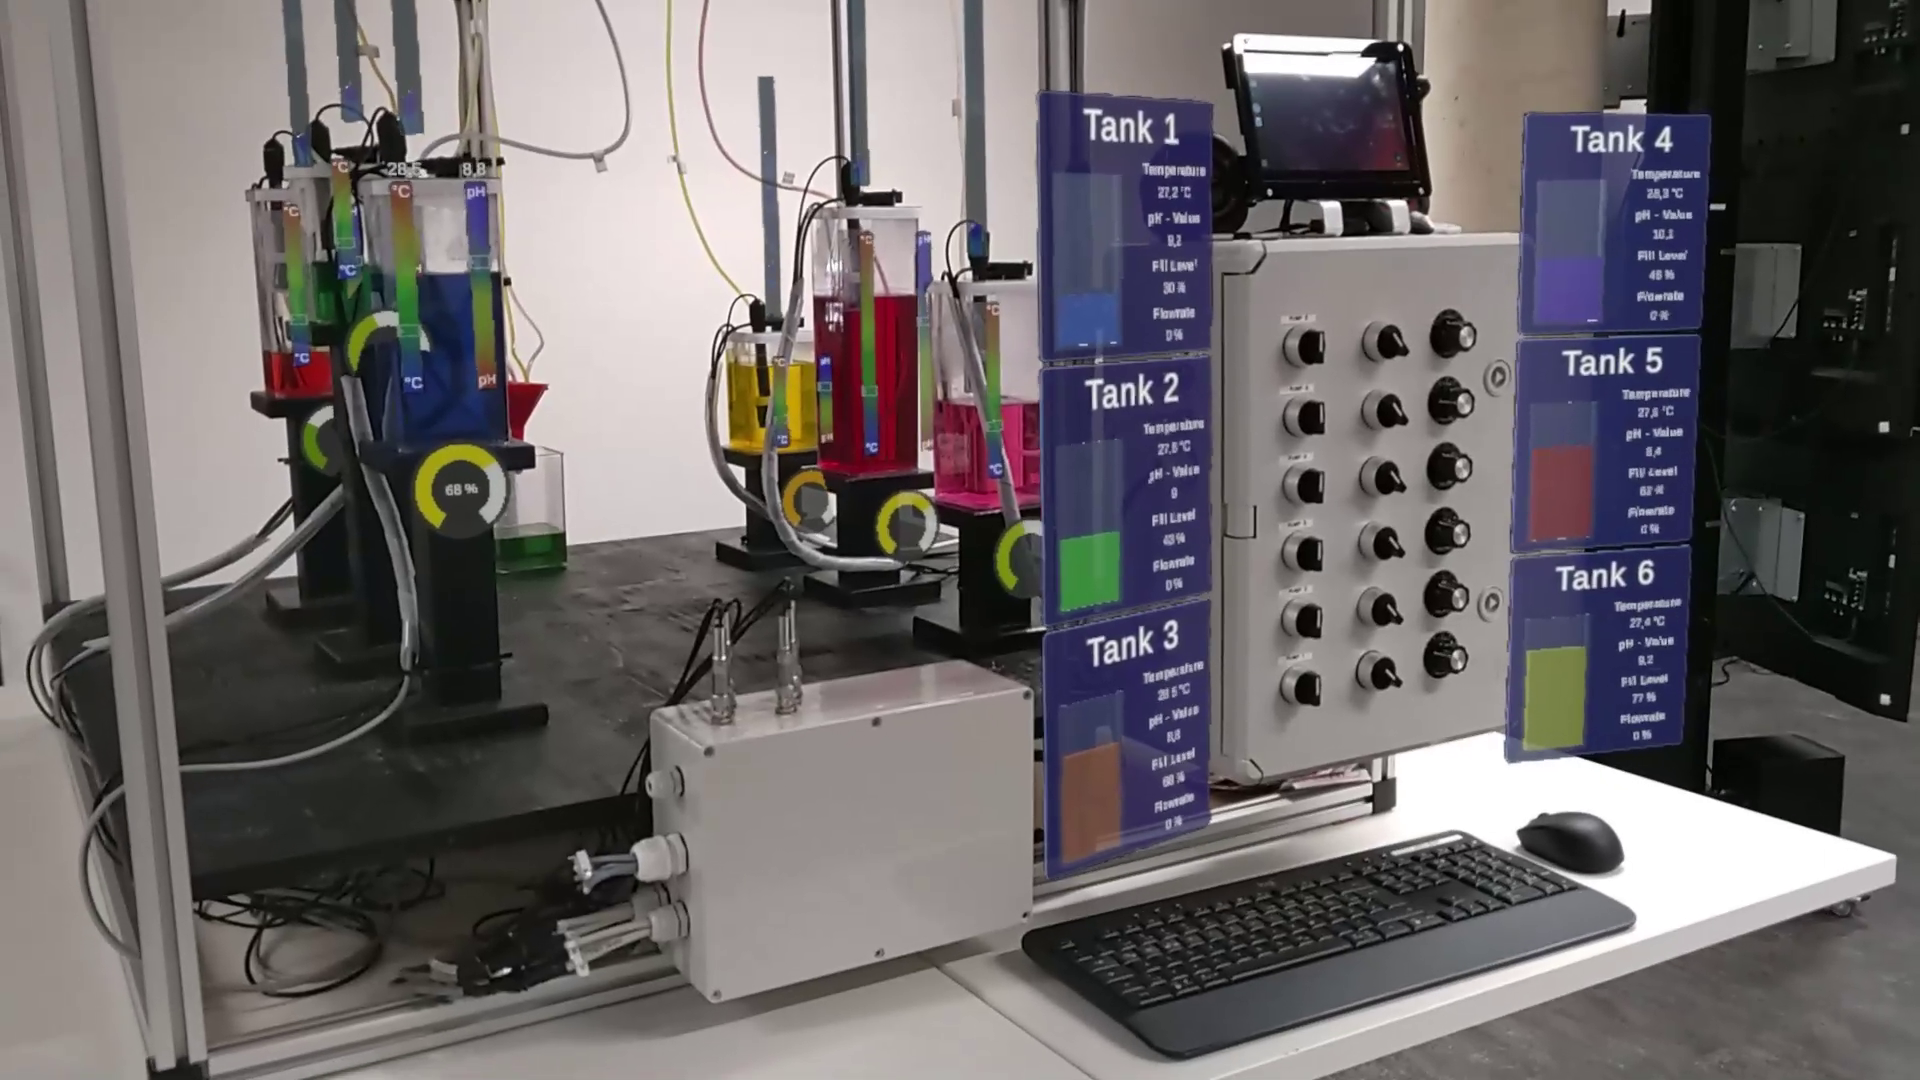
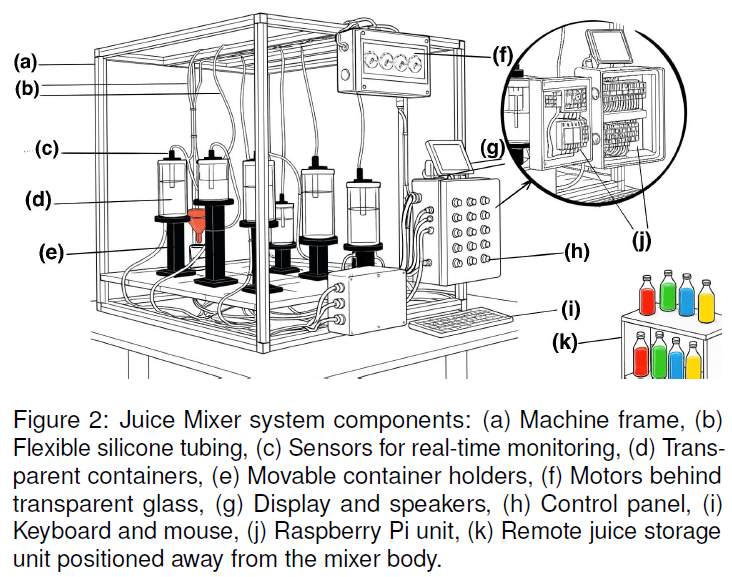
The JuiceMixer is a physical process rig with liquid vessels, sensors and pumps. It provides a testbed for connecting equipment with digital information. A HoloLens 2 headset presents the AR interface, and a related VR model supports exploration of the equipment.
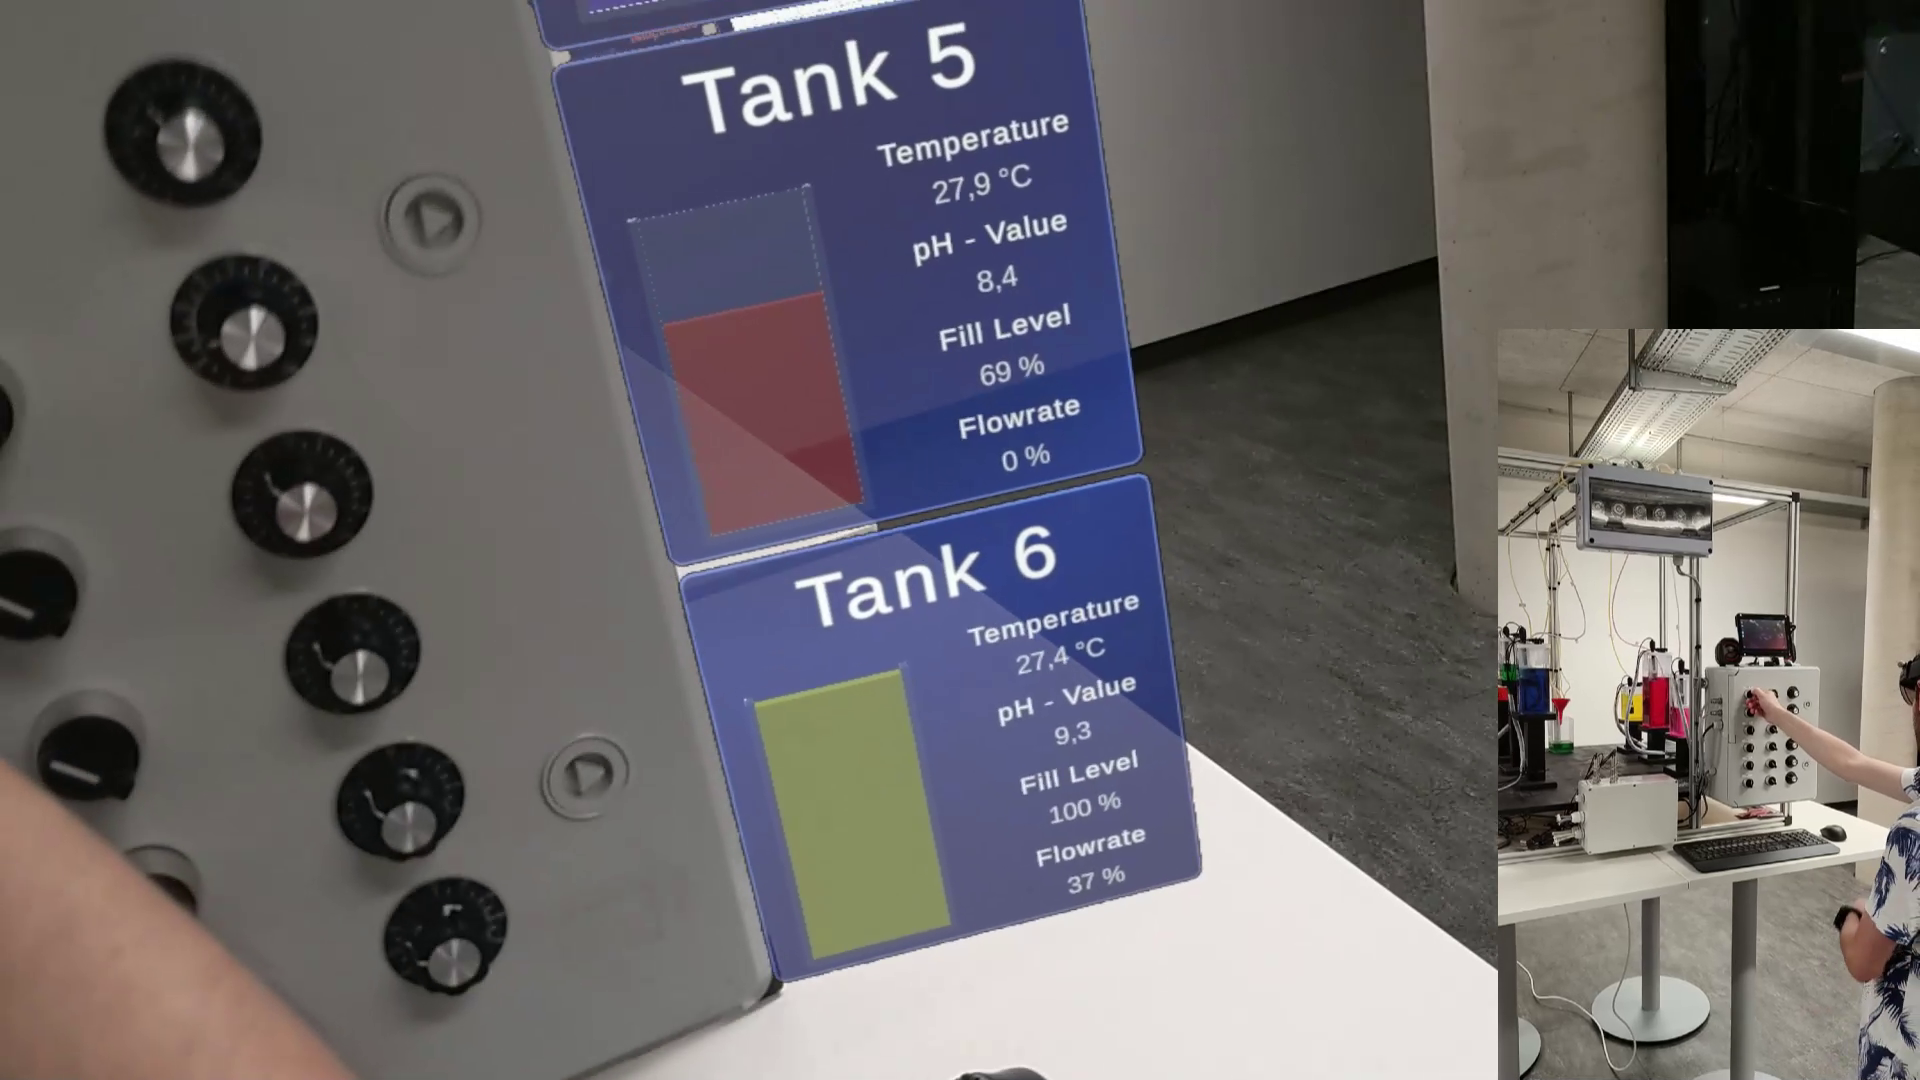
Operators can move from an overview of the process to readings and trends for an individual vessel. The related VR views support exploration of equipment layout, interaction and assembly.
Conventional dashboards often separate measurements from the equipment being inspected. Operators must identify which component a value belongs to and relate it to the current process state. This becomes harder when several similar vessels or components need attention.
The testbed combines an instrumented physical process, a digital equipment model and an AR data interface. The application associates each selected measurement or trend with its corresponding vessel, giving operators a component-level view of the process.
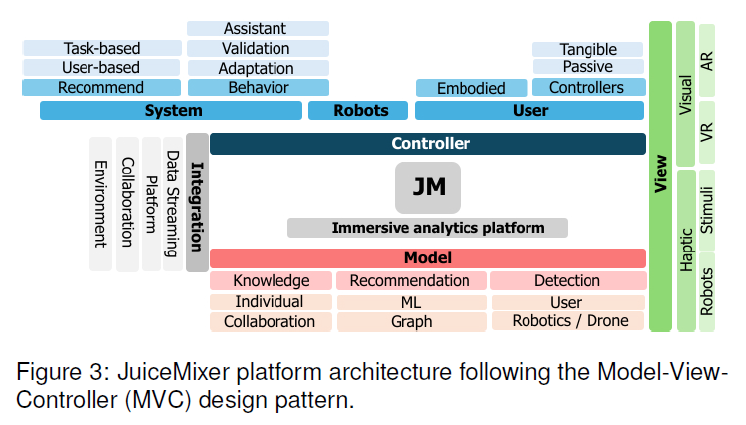
A Raspberry Pi coordinates sensing and control on the testbed. Python and Flask provide backend services. MQTT messaging carries live data and commands, while InfluxDB 2.0 stores historical readings. The Unity application retrieves selected values and trends for display around the physical equipment.
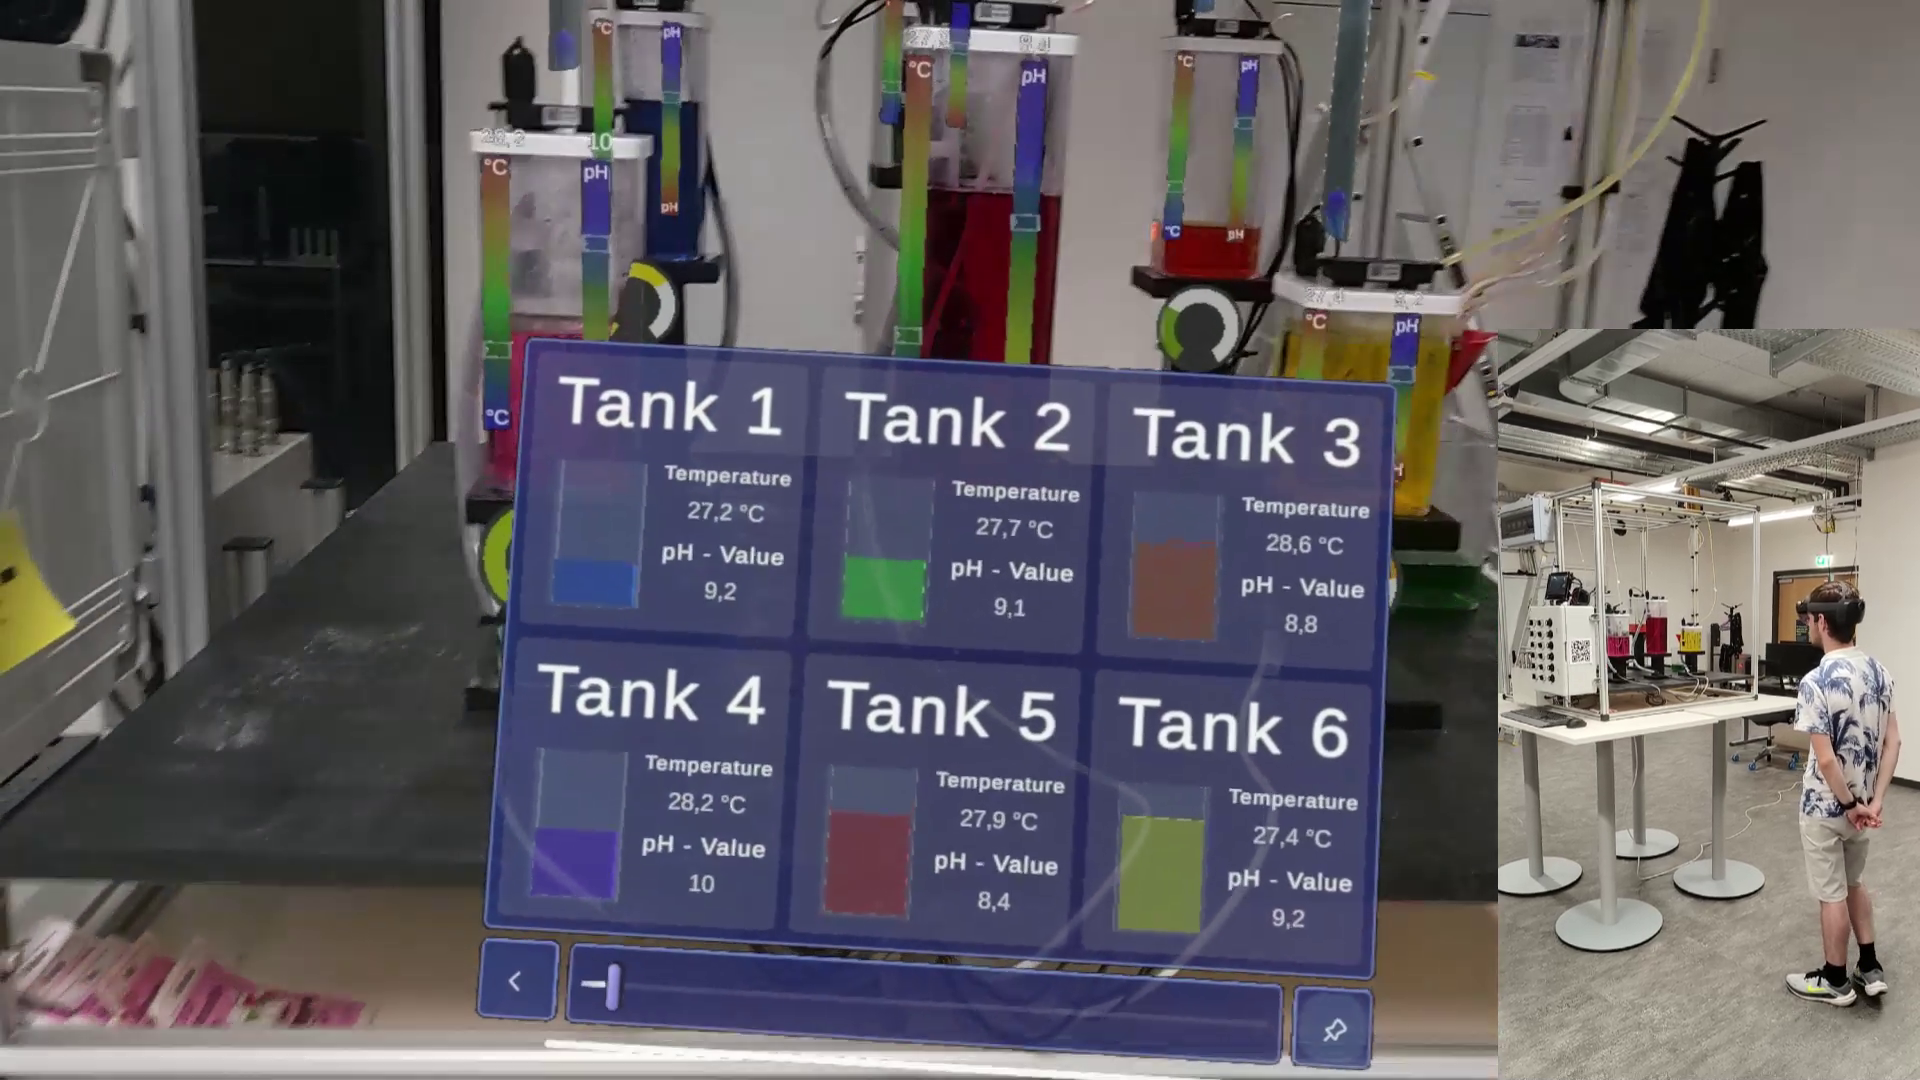
Through HoloLens 2, an operator selects a vessel and inspects its current readings or historical trends. MRTK, the Mixed Reality Toolkit, supports hand interaction through pinch, touch and grab gestures. The related VR view provides a separate way to explore equipment interaction and assembly.
Temperature and pH sensors measure process conditions, and ultrasonic sensors measure liquid level. Peristaltic pumps move liquid through flexible tubing, while motor speed is used to derive flow-rate information. A Raspberry Pi connects the physical equipment to a Python and Flask backend. MQTT provides messaging over local Wi-Fi, and InfluxDB 2.0 stores time-series data. The AR application is built in Unity for HoloLens 2. This implementation runs on a local network.
Extend the testbed with additional sensors, equipment models, and industrial data interfaces. Industry projects can adapt the visualisations to specific workflows, test them with operators, and define on-site connectivity and performance requirements.
When measurements are separated from the equipment, operators must work out where each reading belongs. Bringing information into the physical workspace can support inspection and investigation of changing process conditions.
Connect readings and historical trends to the vessels, components or locations they describe. Teams can inspect measurements while keeping their relationship to the process visible.
Make relevant information available beside the equipment being inspected. An application could connect approved machine data with an augmented view designed around the operator’s task.
Bring unusual readings, historical changes and component locations together for investigation. Machine-specific indicators and thresholds could be developed around the conditions the team needs to recognise.
A collaboration could identify the measurements, equipment locations and inspection tasks that would benefit from information in context.
Explore research and collaboration →Physical and virtual views of the JuiceMixer testbed.
Augmented reality views of live process data on the JuiceMixer.
First-person view of the augmented reality data interface.
This work is part of DDIA, Data Driven Immersive Analytics in Digital Industries.
DDIA is an FFG COMET Module (2022 - 2026) at Know Center Research GmbH.