Compare process data over time
Explore how measurements change while keeping their equipment or location in view. Linked charts and spatial views can support comparison of process states, operating periods or events along a route.
Potential benefits
- Make differences between operating periods or recorded runs easier to investigate.
- Connect changes in a chart with the location or equipment involved.
- Support clearer discussion of process variation between analysts and other teams.
Relevant challenges
Process Improvement and Decision Support
- It can be difficult to understand why a process performed differently at different times
- Historical data can be difficult to relate to specific machine states or events
How the approach works
Time-series charts are linked to the locations or components behind the measurements. Users can compare traces, select a period or position and inspect related detail in a spatial view.
Research and demonstrations
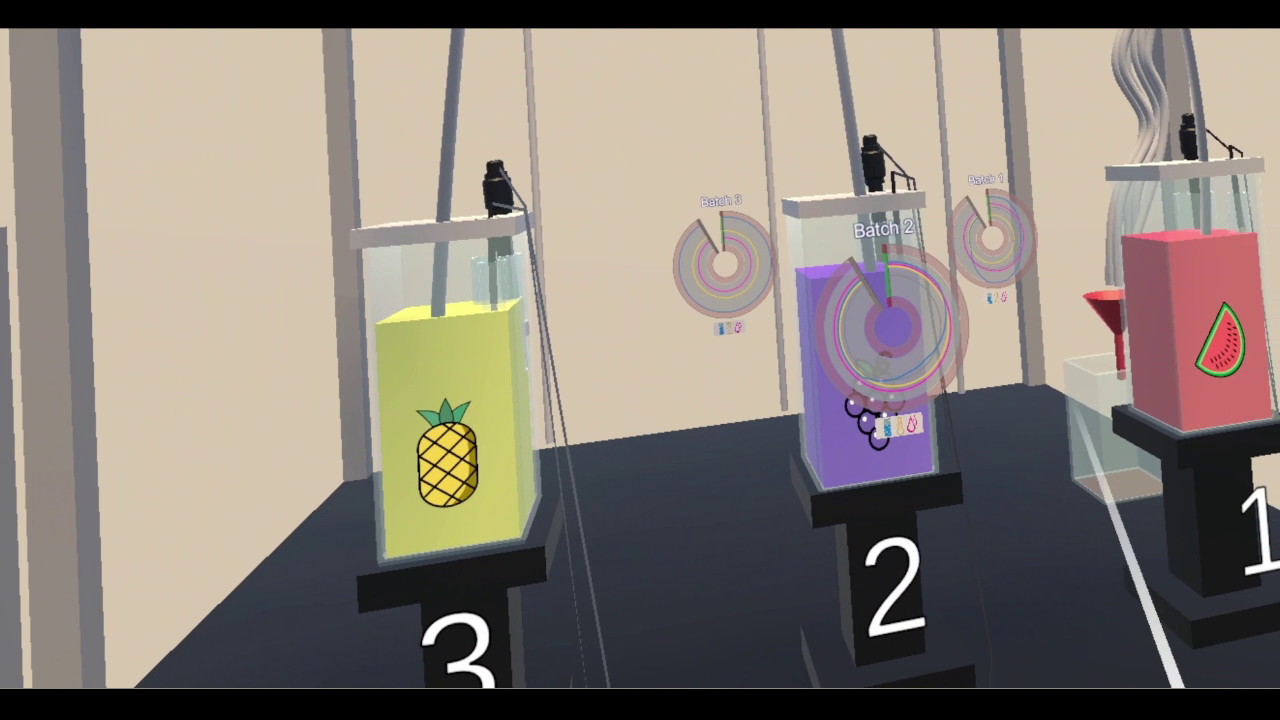
The virtual reality (VR) analysis platform includes process readings around virtual vessels and racing measurements linked to a 3D track. The racing study explores combined chart and spatial views for expert comparison.
Adapting it to your workflow
A project would map a suitable dataset, identify the comparisons users need to make and define how selections should connect charts with the equipment or route. The views would be evaluated with the intended analysts.
What a project could evaluate
Measures could include interpretation accuracy, the ability to locate differences in context and the usefulness of the views for defined analysis questions.